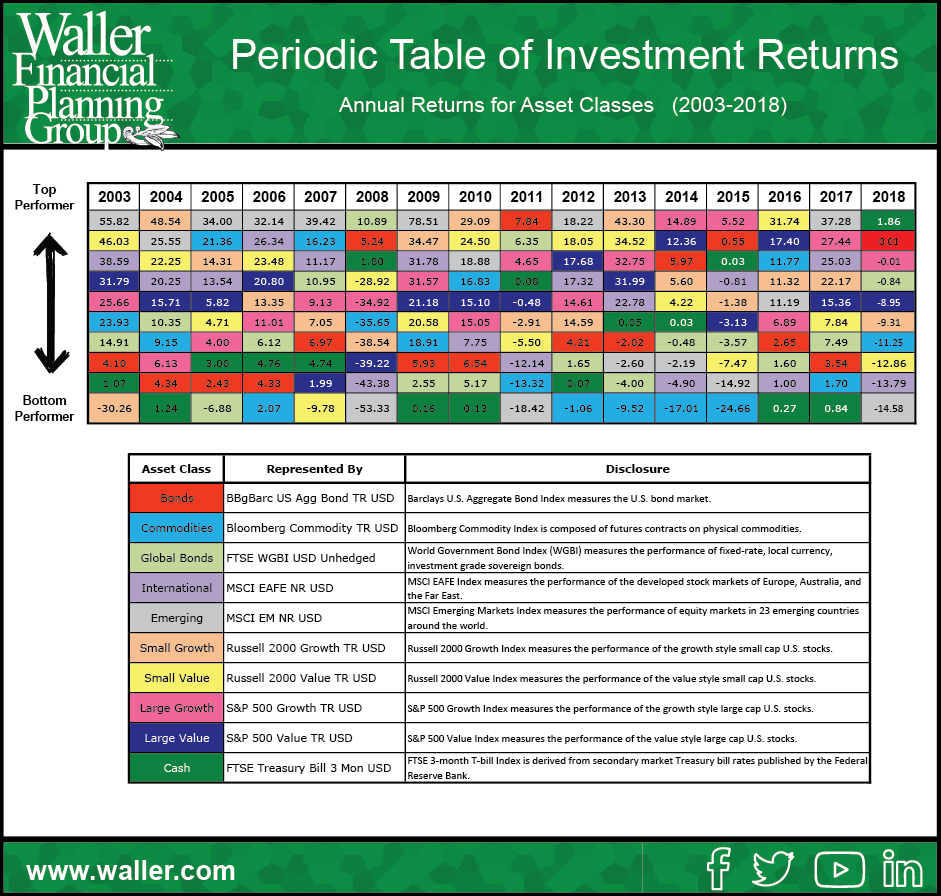
The Callan Periodic Table of Investment Returns is a beneficial tool used to illustrate fundamental investing principles.
There are various iterations, but all generally show investment returns for various asset classes, ranked from best (top) to worst (bottom). Each asset class is assigned a unique color-coding. Each column represents a calendar year.
The chart is intended to show the importance of diversification across asset classes (stocks versus bonds), investment styles (growth versus value), capitalizations (large versus small) and equity markets (U.S. versus international).
The rankings change every year, thereby demonstrating several key investing principles and concepts.
Diversification is a key investment principle many investors implement in their portfolios. Yet, diversification may make it more difficult to evaluate the performance of your investment portfolio – there are more asset classes and each will likely differ in allocation weightings.
The Periodic Table of Investment Returns is an extremely useful resource for investors. It is a simple visual tool to help set your expectations regarding your investment performance. By the mere definition of diversification, your investment performance will not be as strong as the top performing asset class and will not be as poor as the bottom performing asset class. Make it a habit to review The Periodic Table of Investment Returns chart to gain a better understanding of the investment market as a whole and to help maintain realistic expectations about investment performance.